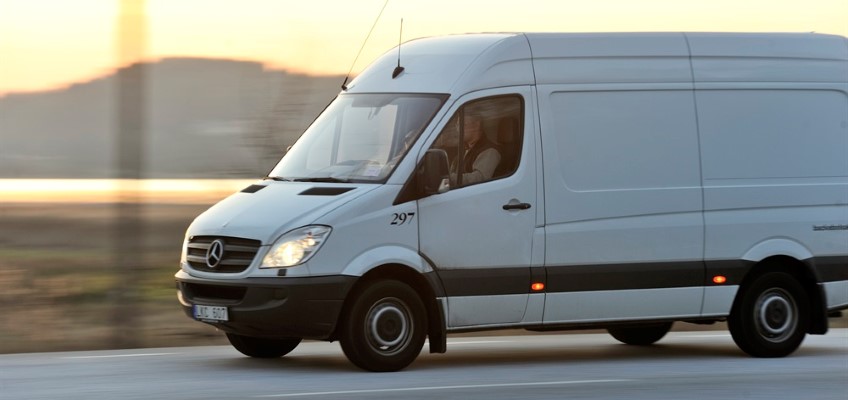
Light goods vehicles
In 2022, Transport Analysis conducted the first full-scale pilot survey of traffic and transport by light goods vehicles; Light goods vehicles 2022. Tables with statistics and a descriptive report were first published on May 25, 2023.
The statistics describe how light goods vehicles (LGVs) are used; for goods transport or for crafts/services, how far an LGV is driven in a year or a day, how many kilos of goods/goods are loaded, the type of goods in the load and how many stops an LGV makes during a working day.
Publication
The statistics are presented in five tables in an Excel annex (see "tables") and described in text and figures in a report. The implementation of the survey is described in a detailed methodological report.
About the survey
The number of light goods vehicles is growing rapidly. Today there are about 600,000 Swedish-registered light goods vehicles in traffic, twice as many as in 2000. Knowledge of the use of these LGVs is limited. In a previous government assignment, we have described how knowledge of LGVs can be increased, both in the short and long term.
One of the actions proposed in the assignment was a survey of a sample of LGVs. Such a survey was carried out in 2022; Light goods vehicles 2022.
Most EU countries are seeing a rapid increase in the number of LGVs and statistics on the use of these vehicles are scarce. For several years, Eurostat has been running a working group with the aim of developing statistics on LGVs – Task Force on Light Utility Vehicles (LUVs) – where Transport Analysis represents Sweden. Within the framework of this work, Eurostat provides financial support for the production of statistics on LGVs. For our survey Light Goods Vehicles 2022, we receive a grant of 300,000 Euros from Eurostat (the European Commission).
Scope of the survey
The survey is limited to light goods vehicles owned by companies (legal entities and sole traders). In 2022, a total of 10 000 questionnaires were sent to LGV owners. We asked questions about how their vehicle was used on a specific measurement day. The measurement days were evenly distributed throughout the year and the response rate to the survey was 47 per cent.
All statistics based on the surveys are expanded to represent all company-owned light goods vehicles (excluding vintage, specialised and rental vehicles).

